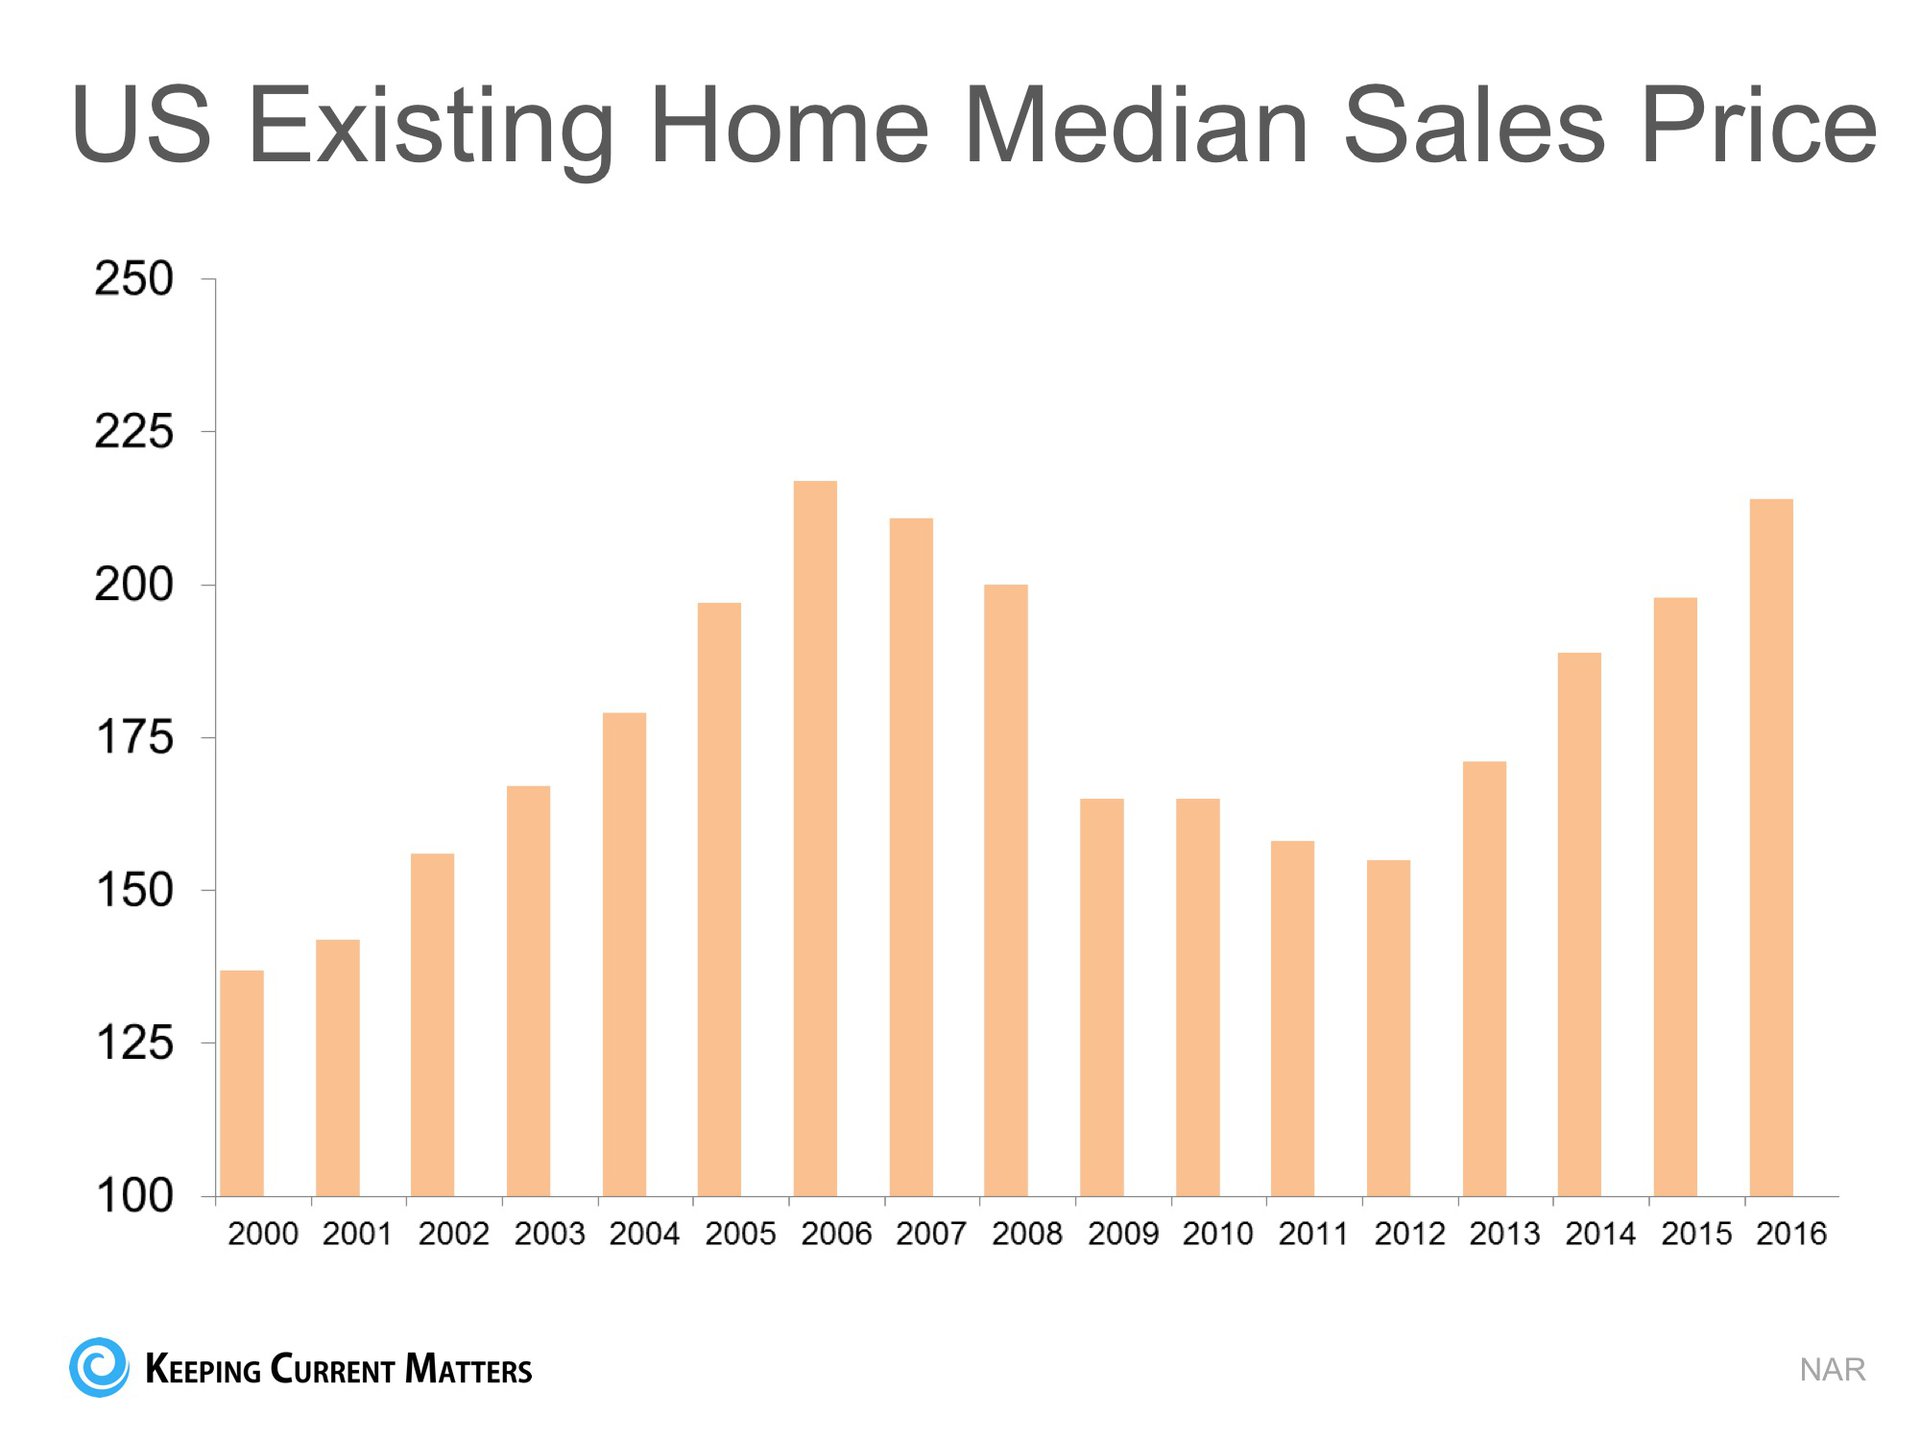
The graph definitely looks like a rollercoaster ride. And, as prices begin to reach 2006 levels again, it “seems logical” that the next part of the ride would be downhill. However, this graph includes the difference of the bubble price and the correction (the housing crash).
What if the bubble & bust didn’t occur?
Let’s assume that instead of the rise and fall in home prices that we saw last decade, we just had normal historic appreciation from 2000 to today. According to the 100+ experts that are surveyed for the Home Price Expectation Survey, normal annual appreciation for residential single family homes from 1987 to 1999 was 3.6%.
Starting with the median home price in 2000, we added 3.6% to it each year since then. Here is that graph intermixed with the above graph.
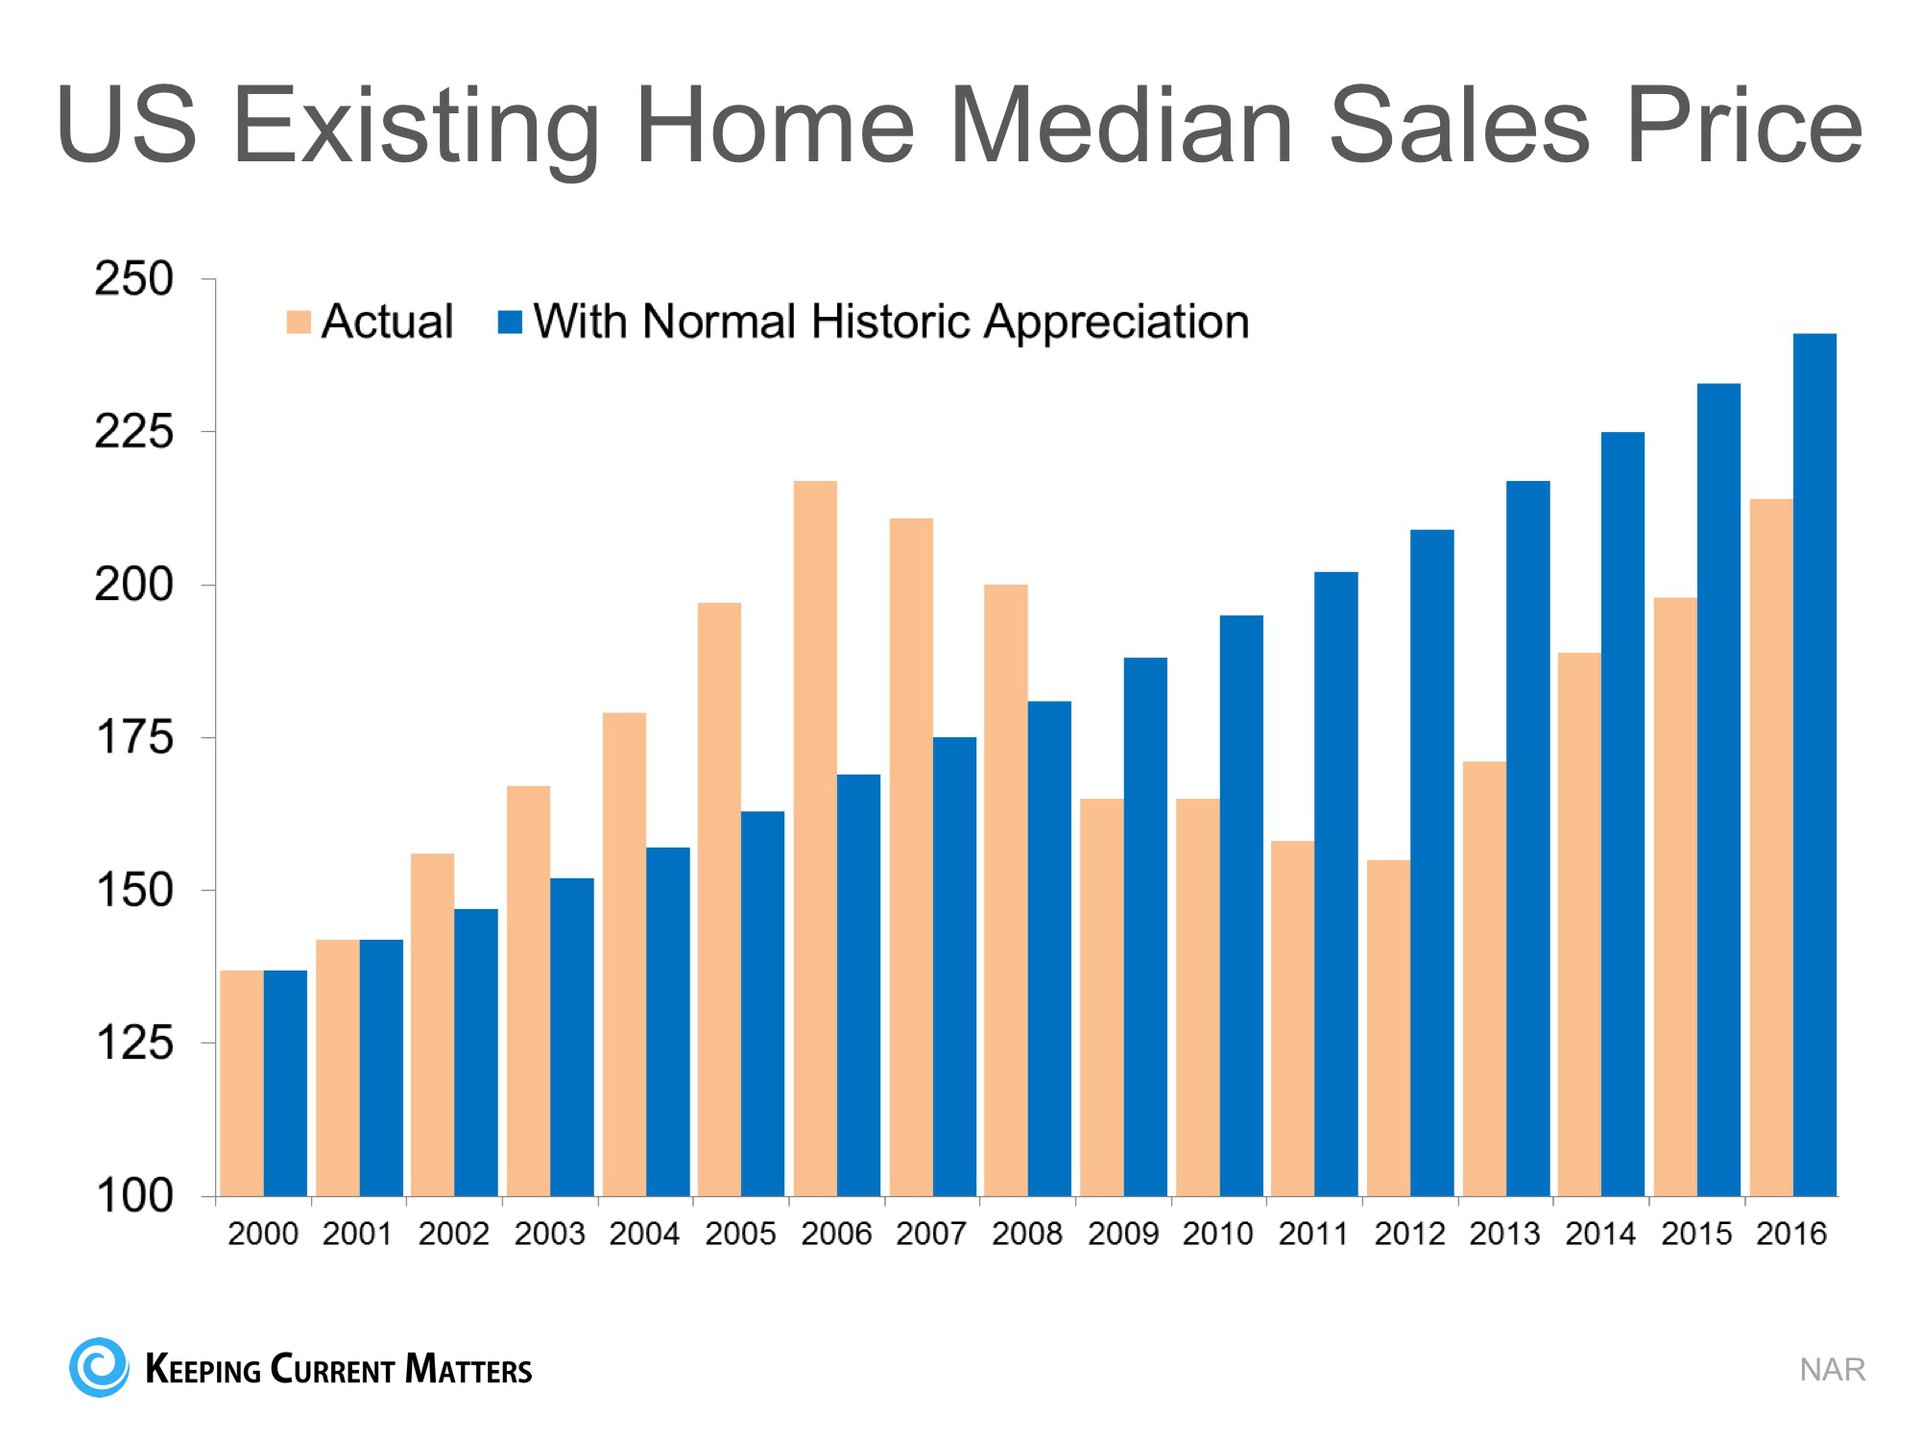
What this shows us is that, had the bubble and crash not occurred and instead we just had normal annual appreciation over this period, prices would actually be greater than they are today.
Bottom Line
The only thing predictable about real estate is that it’s unpredictable. Based on this explanation, there is no reason for alarm as prices seem to be right in line with where they should be.