
Last week, the National Association of Realtors (NAR) released their most recent Existing Home Sales Report. According to the report:
“The median existing-home price for all housing types in January was $240,500, up 5.8 percent from January 2017 ($227,300). January’s price increase marks the 71st straight month of year-over-year gains.”
Seventy-one consecutive months of price increases may have some concerned that current home values may be overinflated.
However, at the same time, Zillow issued a press release which revealed:
“If the housing bubble and bust had not happened, and home values had instead appreciated at a steady pace, the median home value would be higher than its current value.”
Here are two graphs that help show why home prices are exactly where they should be.
The first graph shows actual median home sales prices from 2000 through 2017.
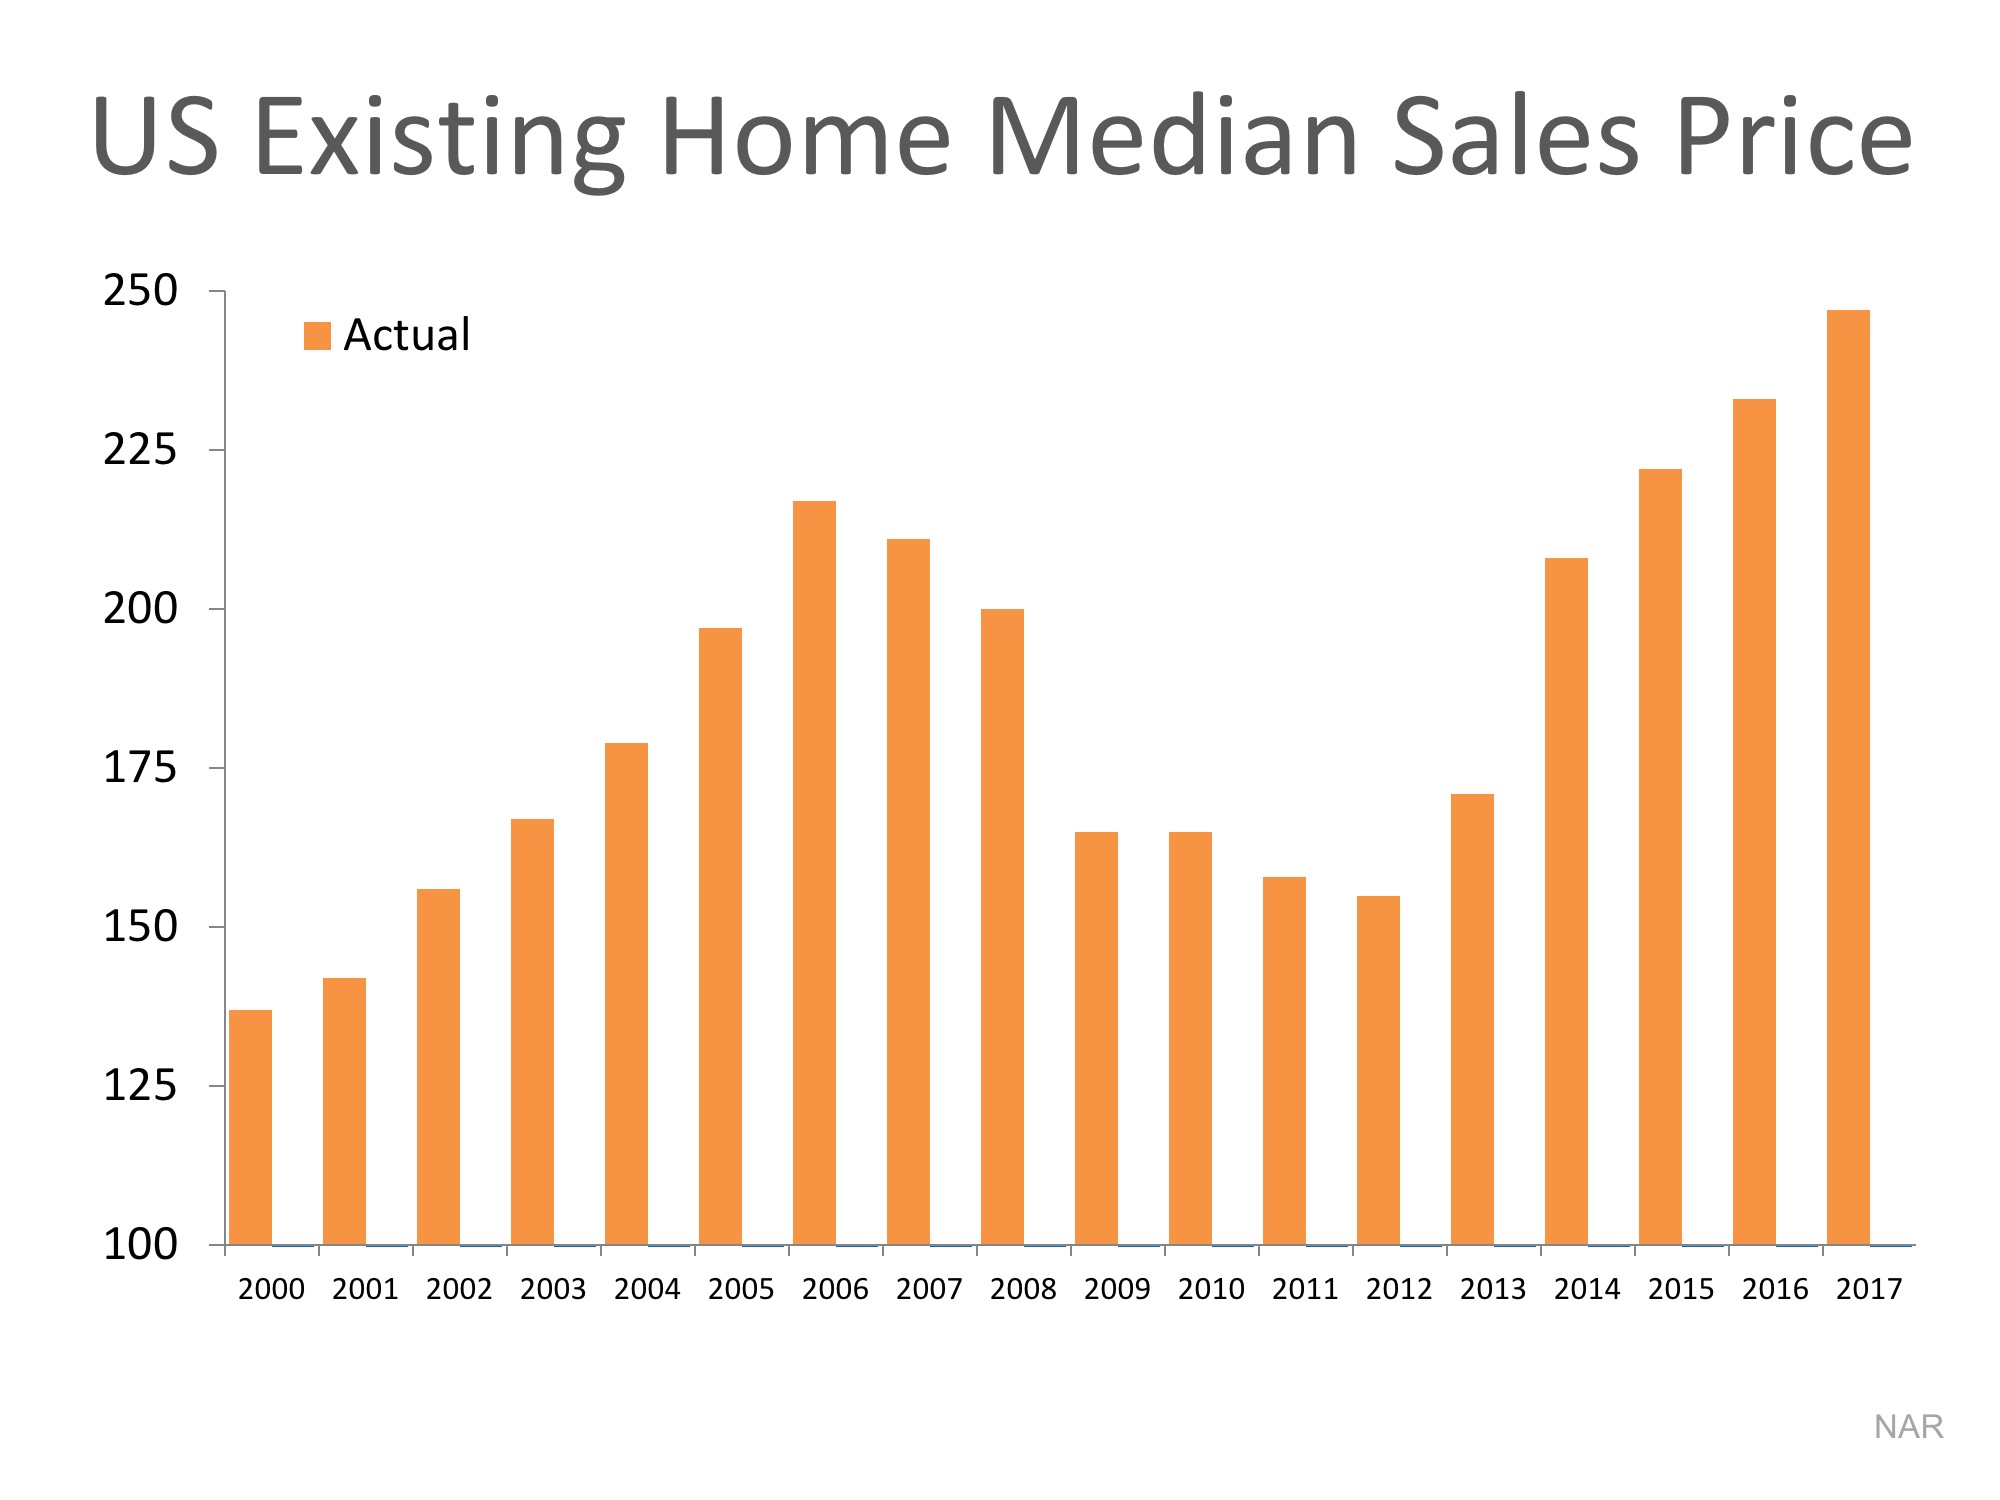
By itself, this graph could heighten concerns as it shows home values rose in the early 2000s, came tumbling down and are now headed up again. It gives the feel of a rollercoaster ride that is about to take another turn downward.
However, if we also include where prices would naturally be, had there not been a boom & bust, we see a different story.

The blue bars on this graph represent where prices would be if they had increased by the normal annual appreciation rate (3.6%). By adding 3.6% to the actual 2000 price and repeating that for each subsequent year, we can see that prices were overvalued during the boom, undervalued during the bust, and a little bit LOWER than where they should be right now.
Bottom Line
Based on historic appreciation levels, we should be very comfortable that current home values are not overinflated.
Powered by WPeMatico